
Marketing Attribution Is Broken: How to Actually Measure ROI in 2026
Open any ad platform dashboard right now. Google Ads says ROAS is 4.2. Meta Ads says 3.8. Your analytics tool credits email with half your revenue. Add up the “revenue” every platform claims, and the total is larger than your actual bank deposits. Sometimes much larger.
This is not a rounding error. It is the defining measurement problem of modern marketing, and most businesses are making six and seven figure budget decisions on numbers that are structurally wrong.
The uncomfortable truth: there is no perfect attribution model coming to save you. Apple, Google, and regulators have spent five years dismantling the tracking infrastructure that last-click attribution was built on, and it is not coming back. What follows is an honest breakdown of what broke, what each remaining model actually measures, and the practical framework that sophisticated marketing teams use to make budget decisions with imperfect data.
Your ROAS Numbers Are Lying to You (Here Is the Proof)
Start with a simple test any business can run. Take one month. Add up the conversion value reported by Google Ads, Meta Ads, and any other paid platform. Then compare that total to actual revenue in the accounting system for the same period.
In almost every multi-channel account, the platforms claim more revenue than the business actually earned. This happens because each platform uses its own attribution window and happily takes credit for the same conversion. A customer clicks a Meta ad on Monday, clicks a Google search ad on Thursday, and buys. Both platforms report the sale. The business counts it once.
This double counting was always present, but it used to be a manageable 10 to 20 percent inflation that experienced marketers mentally discounted. Privacy changes have made it far worse, because the missing data does not disappear evenly. It disappears in ways that systematically flatter some channels and punish others.
A concrete illustration makes the scale tangible. Imagine a business spending Rs 10 lakh a month split across Google and Meta. Google reports 400 conversions at Rs 1,000 CPA. Meta reports 350 conversions at Rs 1,140 CPA. The dashboards suggest 750 total conversions. But the CRM shows 500 actual customers. Some overlap is legitimate multi-touch, but a large share is double counting plus modeled conversions filling gaps where tracking failed. If the business scales the “winning” channel based on dashboard CPA alone, it is optimizing a mirage. The blended CPA that matters, Rs 10 lakh divided by 500 real customers, is Rs 2,000, roughly double what either platform implies on its own. Until that blended number is the one on the weekly report, every budget conversation starts from fiction.
Consider what changed. When Apple introduced App Tracking Transparency with iOS 14.5, it required explicit user consent for cross-app tracking. Opt-in rates settled around 25 percent globally according to industry analyses, which means roughly three out of four iOS users became invisible to the deterministic tracking that ad platforms relied on. Meta responded with Aggregated Event Measurement, a modeled system that estimates rather than observes conversions from opted-out users. Modeled is not measured. It is an educated guess, and guesses have error bars that platforms do not show you.
Safari’s Intelligent Tracking Prevention caps cookies at seven days, and just 24 hours for traffic that arrived via an ad click. More than 31 percent of internet users run ad blockers. One industry analysis of server-side tracking implementations found that client-side tracking now captures only 60 to 70 percent of actual conversions. The critical detail: the missing 30 to 40 percent is not random. It over-represents younger users, mobile users, multi-device journeys, and privacy-conscious consumers. In other words, attribution does not just undercount. It undercounts exactly the customers most growth-stage businesses are trying to reach.
So when a dashboard reports ROAS of 4.0, the honest translation is: “ROAS is approximately 4.0 on the subset of conversions we could observe, weighted toward the users easiest to track, with modeled fill-ins for the rest.” Nobody makes budget decisions on that sentence, but everyone should understand it is the real one.
Why Last-Click Attribution Is Broken
Last-click attribution gives 100 percent of the credit for a conversion to the final touchpoint before the purchase. It survived for two decades because it was simple, auditable, and good enough when tracking was reliable. Every one of those conditions has now failed.
The iOS problem. Last-click needs to see the click. When a user opts out of tracking on iOS, the platform cannot deterministically connect the ad click to the purchase. Meta’s Aggregated Event Measurement allows only a limited set of ranked events per domain, with delayed reporting. The “last click” in the report may be a modeled reconstruction rather than an observed event. Decisions built on it inherit the model’s blind spots.
The cross-device problem. A large share of considered purchases now span devices: research on mobile, purchase on desktop, or the reverse. Last-click attribution tied to cookies or device IDs routinely breaks this chain. The mobile touchpoint that started the journey gets zero credit, and the desktop touchpoint that closed it gets everything. Budgets then flow away from the discovery channels that actually create demand.
The view-through problem. Last-click only counts clicks. But a meaningful share of advertising works through views, not clicks: the YouTube ad watched to completion, the Instagram story seen three times, the display banner noticed in passing. These impressions influence purchases without generating a click to attribute. Under last-click, upper-funnel formats look worthless right up until you turn them off and watch branded search volume collapse.
The cookie deprecation problem. Even where users have not opted out of anything, the identifiers themselves are decaying. Safari’s seven-day cap means a click-to-purchase journey longer than a week loses its thread. Third-party cookie deprecation in Chrome’s ecosystem removed the cross-site glue entirely. Last-click on a 30-day lookback window is now, for a large fraction of traffic, last-click on seven days of memory.
None of this means last-click is useless. It answers a narrow, honest question: what happened immediately before this conversion, among the conversions we could observe. For low-volume accounts, short sales cycles, and simple reporting, that narrow answer is fine. The failure is treating it as the answer to “which channels drive revenue,” a question it was never designed to answer and can no longer plausibly pretend to.
Attribution Models Compared Honestly
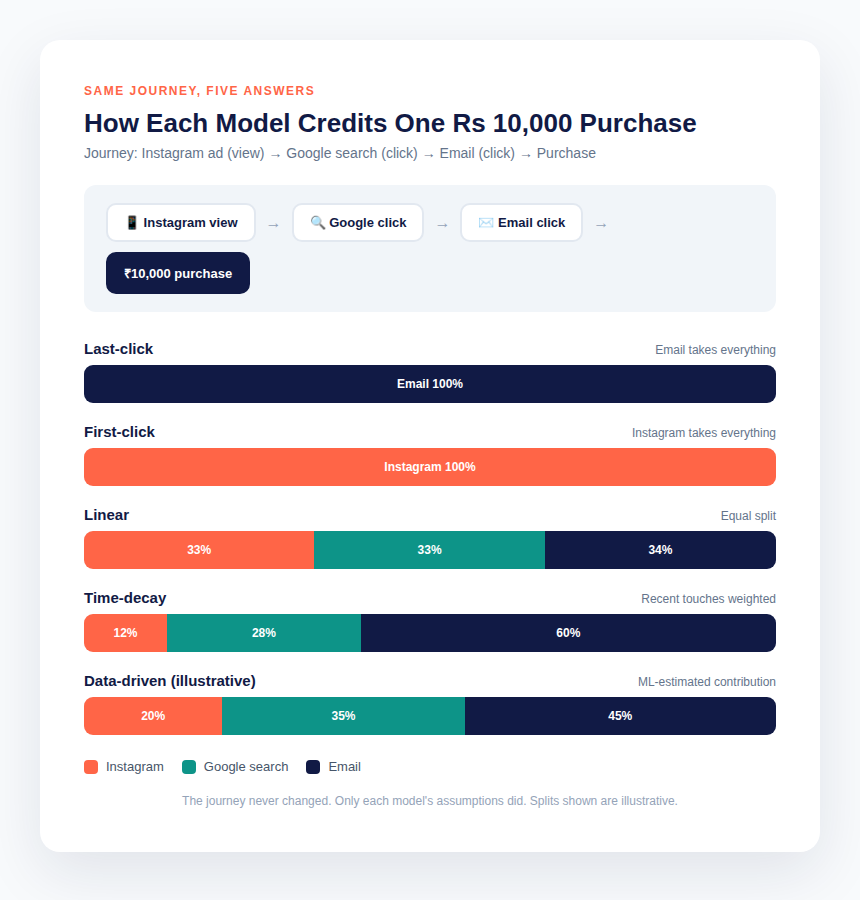
Walk through the same customer journey under each model. A prospect sees an Instagram ad (no click), later clicks a Google search ad, then clicks an email link, then purchases for Rs 10,000. Here is how each model divides the Rs 10,000 of credit.
Last-click: Email gets Rs 10,000. Everything else gets zero. Simple, auditable, and systematically blind to everything that created the demand. Best suited to small accounts with short cycles where the journey genuinely is one click. Actively harmful when used to judge prospecting channels.
First-click: Instagram gets Rs 10,000. The mirror image of last-click. It correctly honors demand creation but ignores everything that closed the deal, including the email that may have carried a discount code doing the real work. Useful for one specific question, “what introduces customers to us,” and misleading for every other question.
Linear: Rs 3,333 to each touchpoint. Democratic and indefensible. It assumes the Instagram view, the search click, and the email click contributed equally, which is true almost never. Linear flatters whatever touches appear most often in paths, which usually means retargeting and email, the channels that show up everywhere precisely because the customer was already going to buy.
Time-decay: most credit to email, least to Instagram. Typically implemented with a seven-day half-life, so recent touches dominate. More sophisticated than linear, but the decay curve is arbitrary. There is no empirical reason a touch three days ago deserves exactly twice the credit of a touch six days ago. It is a guess dressed as math.
Position-based (U-shaped): 40 percent to first and last, 20 percent split among the middle. Google retired this model, along with first-click, linear, and time-decay, from GA4 in November 2023. It survives in some third-party tools. Its 40-20-40 split is a convention, not a finding. Conventions are fine when everyone understands them as conventions. They become dangerous when reported as measurement.
Data-driven attribution (DDA): credit split by modeled contribution. This is the current default in Google Ads and GA4, and it is genuinely more sophisticated. Instead of applying a fixed rule, DDA uses machine learning to compare the paths of customers who converted against those who did not, estimating each touchpoint’s incremental contribution. In the example journey, it might assign something like 20 percent to Instagram, 35 percent to search, and 45 percent to email, with the exact split learned from the account’s own data.
DDA deserves its status as the best widely available option, but its limits matter. Google’s own guidance suggests it needs substantial volume to model reliably, with practitioners citing thresholds around 200 conversions and 2,000 ad interactions per 30 days in supported networks. Below that, it falls back toward rules-based behavior without always making that obvious. More fundamentally, DDA can only model the paths it can observe. It inherits every iOS, cookie, and cross-device blind spot described above, then applies sophisticated math to incomplete data. Sophisticated math on incomplete data produces confident-looking numbers, which is arguably more dangerous than last-click’s obvious crudeness.
Marketing mix modeling (MMM): no touchpoints at all. MMM works top-down instead of bottom-up. It takes aggregate weekly spend by channel, total revenue, and external factors like seasonality, pricing, and promotions, then uses statistical techniques to estimate each channel’s incremental contribution. It needs roughly two years of weekly data, around 104 observations, to learn seasonality patterns. It cannot tell you which ad creative won. It answers a different question entirely: how should the total budget be allocated across channels, including the offline, brand, and influencer spend that click-based attribution can never see.
The honest summary: every click-based model is a different way of slicing observed journeys, and the observations themselves are now partial. MMM sidesteps the observation problem by not needing user-level tracking at all, which is why it has surged back into relevance, but it demands data volume, statistical expertise, and patience that most mid-size businesses do not have in-house.
Above: the same Rs 10,000 purchase credited five different ways. The journey did not change. Only the model’s assumptions did. Custom diagram by SCORSH.
What Each Model Gets Wrong
It is worth being explicit, because vendors and platform reps rarely are.
Last-click gets demand creation wrong. It starves the top of the funnel. A business that optimizes purely on last-click ROAS will, over 12 to 18 months, defund every prospecting channel, watch branded search decay, and then wonder why the “efficient” bottom-funnel campaigns stopped converting. The efficiency was borrowed from demand someone else built.
First-click gets closing wrong. It overvalues introductions. A viral video that introduces a million people who never buy looks like a hero under first-click. Retargeting and email, which do the unglamorous work of closing, look like cost centers.
Linear and time-decay get causality wrong. Distributing credit is not the same as measuring contribution. These models describe where touches happened, not what would have happened without them. A touchpoint present in every converting path gets generous credit under linear even if removing it would change nothing. This is the correlation versus causation trap, formalized into a dashboard.
Data-driven attribution gets completeness wrong. Its math is the best available, but it models only observed paths. When 30 to 40 percent of conversions are invisible to client-side tracking, DDA is learning from a skewed sample. The skew is not neutral: it underweights mobile-first, privacy-conscious, multi-device buyers. DDA also optimizes within Google’s own inventory remarkably well and across the whole business less well, a structural bias worth remembering given who builds the model.
MMM gets granularity and speed wrong. It cannot evaluate a single campaign, creative, or keyword. It needs years of data, which young companies do not have. Its outputs come with confidence intervals that executives routinely ignore. And it is only as good as its inputs: thin or gappy data produces confident but wrong coefficients, which practitioners warn is worse than no model at all. Roughly 70 percent of MMM effort is data preparation, not modeling, a ratio that surprises every team attempting it the first time.
Platform-reported attribution gets incentives wrong. This is the one nobody puts in a whitepaper. Google and Meta both sell advertising and report on its effectiveness. Their attribution choices, default windows, modeled conversions, and the credit they claim are all shaped, at least partly, by the incentive to make advertising look effective. That does not make their numbers fabricated. It makes them interested. Interested numbers deserve independent verification.
The Practical Framework: Triangulation, Not One Perfect Model
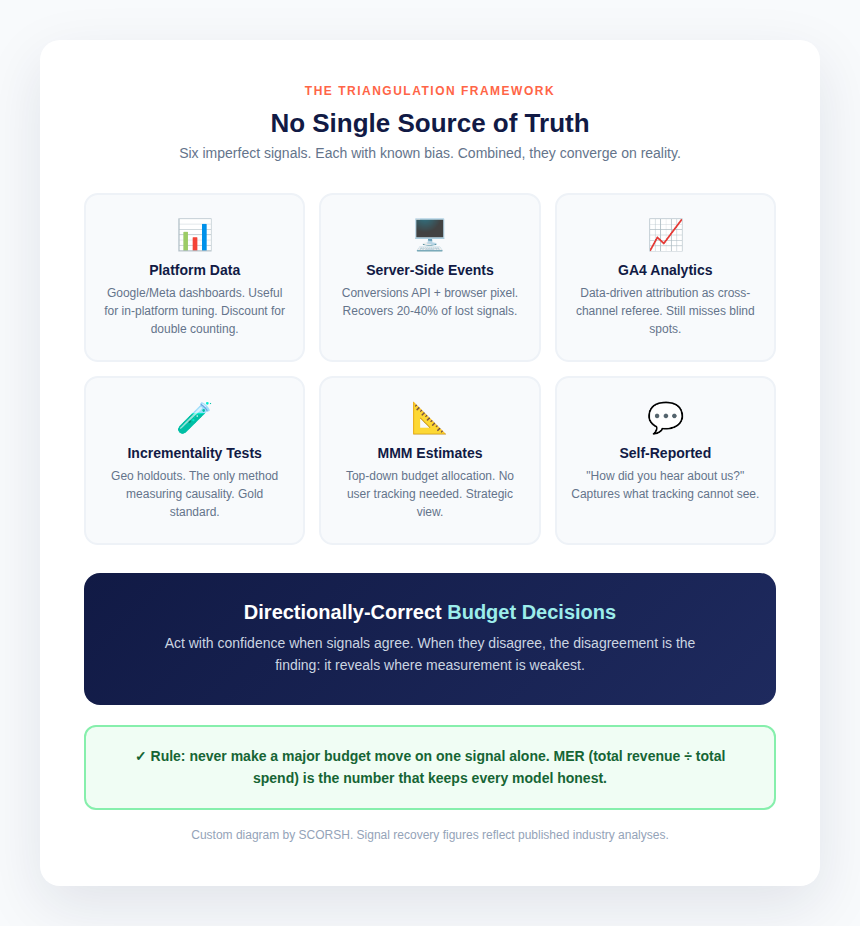
If no single model is trustworthy, the answer is not to pick the least bad one and stop thinking. It is triangulation: combining multiple imperfect measurement methods so their biases cancel rather than compound.
Think of it as navigation. One landmark gives a rough direction. Three landmarks give a position. Each measurement method below is a landmark with known error. Together, they produce directionally correct decisions, which is all budget allocation has ever needed.
Landmark 1: Platform-reported conversions (with a discount). Keep reading Google Ads and Meta Ads dashboards, but stop treating them as truth. Apply a mental haircut based on your own calibration: if accounting revenue is consistently 25 percent below summed platform claims, discount platform ROAS by roughly that amount before comparing channels. The number is still useful for week-to-week optimization inside a platform, where the bias is relatively constant.
Landmark 2: Analytics with server-side reinforcement. GA4’s data-driven attribution, fed by both browser and server-side events, is the best free cross-channel view available. It will still miss things, but it misses them more evenly than any single platform. Treat it as the referee between platforms, not as ground truth.
Landmark 3: Incrementality testing. The only method that measures causality rather than correlation. Hold out a geography, audience, or time period, run the channel, and measure the difference against the control. It is the gold standard and it is expensive, slow, and operationally annoying, which is why most businesses never do it. Even one or two holdout tests per year, on the channels where the most money is at stake, will teach you more than twelve months of dashboard debates. When a test shows a channel’s true incremental ROAS is half its reported ROAS, that single finding reprices every future budget conversation.
Landmark 4: Marketing mix modeling, right-sized. Full MMM is overkill for a business spending on two channels. But the underlying discipline, relating aggregate spend to aggregate revenue while accounting for seasonality, is available to everyone through simpler methods: even a careful spreadsheet correlating weekly spend by channel against revenue, annotated with promotions and external events, beats pure last-click thinking. The spreadsheet version will not survive a statistician’s review, but it forces the right habit, which is thinking in increments and baselines rather than in credited clicks. As spend grows across three or more channels, graduate to proper MMM. SaaS MMM platforms now start around $2,000 per month for smaller businesses, and Google’s open-source Meridian has lowered the technical barrier substantially. The trigger for upgrading is not company size but decision stakes: when a single budget reallocation moves more money than a year of MMM subscription costs, the model has paid for itself before it finishes calibrating.
Landmark 5: Self-reported attribution. Add “How did you hear about us?” to high-intent forms and track the answers in the CRM. It is crude, it is biased toward whatever the customer remembers last, and it is enormously valuable anyway, because it captures the channels that tracking cannot: word of mouth, podcasts, YouTube views, offline mentions. When self-reported data says 30 percent of buyers came from a podcast the dashboards credit with zero conversions, the dashboards are wrong, not the customers.
Landmark 6: CRM revenue, not platform revenue. Connect closed-won revenue back to campaigns with lookback windows that match the actual sales cycle, up to 365 days for long B2B cycles. Optimize toward pipeline and revenue, not form fills. A campaign with a mediocre cost per lead and an excellent close rate is a better campaign than the reverse, and only CRM-connected reporting reveals that.
The triangulation rule is simple: never make a major budget decision on a single landmark. If platform data, analytics, and a holdout test all point the same direction, act with confidence. If they disagree, the disagreement itself is the finding: it tells you where measurement is weakest and where the next test should go.
Disagreements between landmarks are more informative than agreements, because each type of disagreement has a characteristic meaning. When platform-reported ROAS looks strong but MER is flat, the channel is almost certainly taking credit for demand created elsewhere; the customers would have converted anyway, and the platform is taxing inevitability. When GA4 shows a channel contributing but the platform shows nothing, tracking is usually broken on that path, often a missing click ID or an ad-blocked audience, and the fix is technical rather than strategic. When self-reported attribution names a channel that no dashboard credits, that channel is doing invisible work, typically upper-funnel or offline influence, and killing it on dashboard evidence alone is one of the most expensive mistakes in marketing. Learning to read these patterns turns measurement from a reporting chore into a diagnostic discipline.
Above: six imperfect signals converging on one decision. No single source is trusted alone. Custom diagram by SCORSH.
Server-Side Tracking: Why It Matters Now
Everything above gets easier with better raw data, and the single highest-leverage improvement most businesses have not made is server-side tracking.
Client-side tracking means the browser sends conversion events directly to ad platforms via pixels and JavaScript. It breaks whenever the browser is told not to cooperate: ad blockers, Safari’s cookie caps, iOS opt-outs, JavaScript errors, slow connections. Server-side tracking routes events through your own server first, which then forwards them to platforms via APIs like Meta’s Conversions API, Google’s Enhanced Conversions, or TikTok’s Events API. The server-to-server connection bypasses every browser restriction that destroys client-side data.
Industry analyses of server-side implementations consistently report recovering 20 to 40 percent of lost conversion signals. One practitioner benchmark found advertisers using Conversions API seeing roughly 20 percent lower cost per acquisition and about 31 percent more attributed conversions than non-integrated accounts. These are vendor-adjacent figures and should be read with appropriate skepticism, but the direction is consistent across sources: server-side tracking materially improves both measurement completeness and the algorithm’s ability to optimize, since bidding algorithms can only learn from conversions they can see.
The implementation has four parts that matter.
First, run hybrid, not server-only. Keep the browser pixel and add server-side events alongside it, with proper event ID deduplication so the same purchase is not counted twice. Client-side captures real-time signals and micro-conversions; server-side guarantees the important events land even when the browser fails. Either one alone is a compromise.
Second, maximize Event Match Quality. Meta scores how well your events can be matched to users, and practitioners target scores of 8 or above. That means sending complete customer data with each event: hashed email, hashed phone number, and the platform’s browser identifiers. Poor match quality can inflate acquisition costs dramatically, with some analyses putting the penalty at 40 to 60 percent. The API connection alone is not enough; the data payload determines whether it works.
Third, persist click IDs. Capture the gclid, fbclid, ttclid, and msclkid parameters on landing page arrival, store them in first-party cookies and hidden form fields, and pass them with server-side events. Without the click ID, the platform cannot connect the conversion to the campaign that caused it, and the entire exercise loses most of its value. This is the single most commonly skipped step and the single most damaging to skip.
Fourth, treat tracking as production infrastructure. Server-side endpoints need uptime monitoring, error handling, and someone responsible when they break. Hosting costs are modest, typically $20 to $300 per month depending on approach, and implementation takes one to four weeks. For any business spending five figures monthly on advertising, the payback period is measured in weeks. This is also where working with a performance marketing agency that implements tracking properly pays for itself: most in-house setups we audit are missing at least two of the four parts above.
A note on privacy compliance, since it is often raised as an objection: server-side tracking, done correctly, is more privacy-compliant than the pixel soup it replaces. The server gives you centralized control to strip, hash, or transform fields before anything leaves your infrastructure, which is exactly what regulations like GDPR expect. You decide what each platform receives instead of letting a dozen third-party scripts take whatever they want.
How to Make Budget Decisions With Imperfect Data
All of this builds to the actual job: deciding where the next rupee or dollar goes. Here is how to do it without pretending the data is better than it is.
Use MER as the north star, channel ROAS as the instrument panel. Marketing Efficiency Ratio, total revenue divided by total marketing spend, is the one number that cannot be gamed by attribution choices. It moves only when the business actually improves. Channel-level ROAS is still useful for week-to-week tuning, but any channel “optimization” that improves reported ROAS while MER stays flat is measurement theater, not growth.
Set decision thresholds, not precise targets. “Scale any channel holding MER above 4.0” is a workable rule. “Shift 10 percent of budget from the channel at 3.82 ROAS to the one at 3.91” is numerology. The error bars on attribution exceed the differences being optimized. Make fewer, larger, slower budget moves based on triangulated evidence, and give each move time to show up in MER before judging it.
Budget for learning explicitly. Reserve 10 to 20 percent of spend for testing: new channels, new creatives, new audiences. Evaluate the learning budget on what it taught, not its ROAS. A failed test that proves a channel does not work is worth more than a quarter of inconclusive dashboard staring, because it permanently removes a wrong option. The most underrated output of a testing budget is a shorter list of things to argue about. Every conclusive negative result compounds, narrowing future decisions to options with genuine uncertainty rather than recycled opinions.
Run one incrementality test per quarter on your biggest question. Which channel would you scale if you trusted the data? Test that one. Geo holdouts are the most accessible design for most businesses: pause or scale spend in matched regions and compare. The result reprices your assumptions for everything downstream.
Revisit the model annually. Attribution needs change as the business changes. A company doing Rs 50 lakh a year in ad spend across two channels needs GA4 plus server-side tracking and disciplined MER review. The same company at Rs 5 crore across six channels needs MMM in the mix. Match the measurement investment to the decision stakes.
Document your assumptions. Write down, in one page, which attribution model each report uses, what is modeled versus observed, what the known blind spots are, and when the setup was last audited. Most attribution arguments inside companies are really arguments between people looking at different numbers without realizing it. The document ends those arguments.
The Bottom Line
Marketing attribution is broken in the specific sense that no single model now tells the truth about which channels drive revenue. It is not broken in the sense that measurement is hopeless. The businesses measuring well in 2026 share a pattern: they stopped hunting for the one true dashboard and built a system instead. Server-side tracking for complete data. Triangulation across methods for honest interpretation. Incrementality tests for the decisions that matter most. MER as the number that keeps everyone honest.
The platforms will keep reporting flattering numbers. That is their job. Your job is to know exactly how flattering, and to make budget decisions on evidence rather than dashboards. For teams running Google Ads at serious spend, getting this measurement foundation right is usually worth more than any single campaign optimization, because every optimization downstream inherits the quality of the data beneath it.
Start this quarter: implement server-side tracking if it is missing, add the self-reported attribution question to your highest-intent form, and run one holdout test on the channel whose reported numbers you trust the least. Three moves, ninety days, and your budget decisions will be grounded in something dashboards alone can never provide, which is reality.