
Google Ads vs Meta Ads: Where Should Your Budget Go?
Every week, a business owner asks some version of the same question: “Should we run Google Ads or Facebook Ads?” It is the wrong question. Not because the answer does not matter, but because “which platform is better” has no answer. The right question is: “Where does our customer make the decision, and which platform reaches them at that moment?”
This guide replaces the platform debate with a decision framework built on 2026 benchmark data. No fluff, no vendor talking points. Just the numbers, the tradeoffs, and a practical way to split the budget.
The Real Framework: Intent vs Discovery
Forget “Google vs Meta” for a moment. The useful distinction is intent vs discovery.
Google Ads captures existing intent. Someone types “emergency plumber near me” or “project management software for agencies” because they already want the thing. The ad answers a question that was already asked.
Meta Ads manufactures discovery. Someone is scrolling Reels at 11pm, sees a clever video for a skincare serum, and buys something they did not know existed ten seconds earlier. The ad creates the want.
This single difference explains almost every performance gap between the two platforms:
- Click-through rates: Google Search ads average around 6.64% CTR because the click matches an active query. Meta averages around 1.55% because the click interrupts something else. (WordStream/LocaliQ 2026; Meta industry benchmarks 2026.)
- Conversion rates: Ecommerce data from Elogic’s 2026 benchmarks puts paid search conversion at 1.4 to 3.2% and paid social at 0.5 to 1.5%. Intent converts roughly 2 to 3 times better than interruption, all else equal.
- Customer quality: A Kantar study commissioned by Meta in 2026 found that 64% of Meta’s incremental conversions came from new-to-brand customers, people who would not have bought without Meta in the mix. Search harvests demand. Social creates it.
Neither is “better.” They do different jobs. The budget question is really: does your business need harvested demand, created demand, or both?
The Honest Cost Data (2026 Benchmarks)
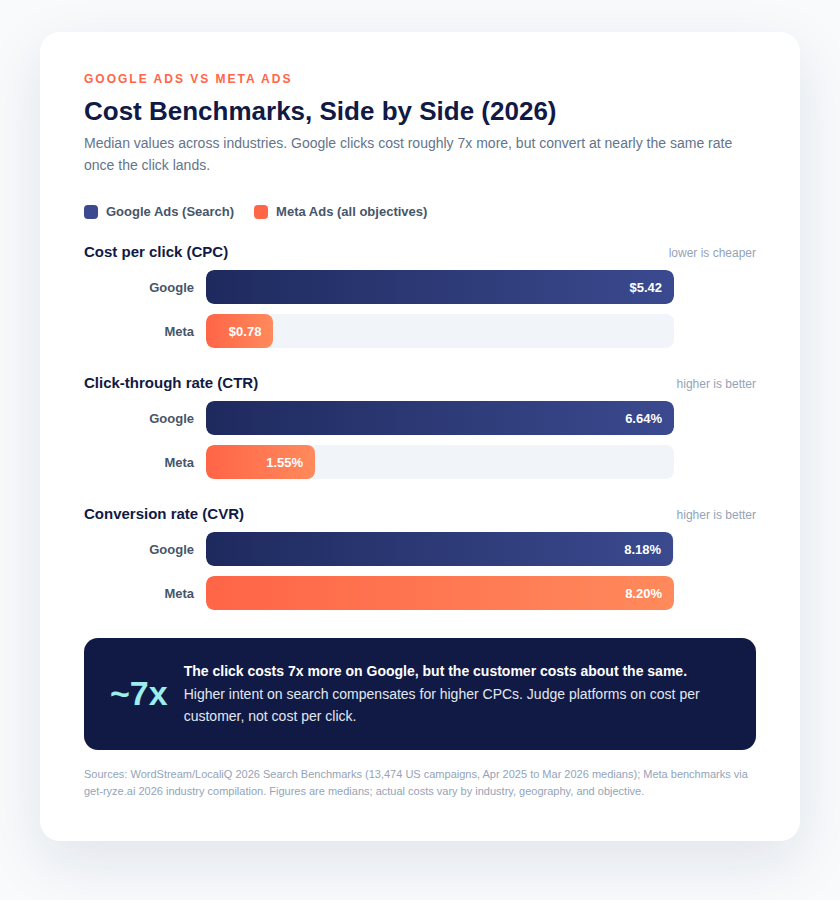
Here is what the platforms actually cost, using the most recent large-sample benchmarks available. All figures are medians, and medians hide wide industry spreads, which the table below addresses.
Google Ads: expensive clicks, strong intent
WordStream and LocaliQ’s 2026 benchmark report analyzed 13,474 US search campaigns from April 2025 to March 2026. The headline medians: $5.42 average CPC, 6.64% CTR, 8.18% conversion rate, and $66.69 cost per lead. Notably, that CPL figure is the first decline in five years, suggesting targeting and automation improvements are finally offsetting click inflation.
That $5.42 average hides enormous variance. A separate 2026 industry compilation puts all-industry average search CPC at $2.96, with the real story in the verticals:
| Industry | Avg search CPC | What drives it |
|---|---|---|
| Legal services | $6.75 | High case values justify aggressive bidding |
| Consumer services | $6.40 | Dense local competition |
| B2B | $3.33 | Niche keywords, long sales cycles |
| Home goods | $2.94 | Shopping-heavy, price comparison |
| Health and medical | $2.62 | Regulated, trust-driven clicks |
| Real estate | $2.37 | High volume, mixed intent |
| Ecommerce | $1.16 | Shopping ads, thin margins |
Two things worth noting. First, CPCs have risen roughly 57% in four years across the board, so any budget planned on 2022 numbers is fiction now. Second, Performance Max campaigns run about 50% cheaper per click than pure Search (Optmyzr’s 24,702-campaign study), and perform best at 10 to 25% of account budget, a useful lever when Search CPCs sting.
What the benchmarks do not tell you
Medians describe the auction; they do not describe your account. Three forces move individual results far from the median:
Quality Score moves Google CPCs more than bidding does. Two advertisers can bid on the same keyword and pay wildly different CPCs. Google’s ad rank formula multiplies bid by Quality Score, so a QS 8 advertiser routinely pays 30 to 50% less per click than a QS 4 competitor for the same position. Benchmark CPCs assume average quality. Above-average landing pages and ad relevance buy clicks at below-benchmark prices.
Creative moves Meta costs more than targeting does. Industry research widely cited in the Meta advertiser community attributes roughly 56% of ad performance to creative quality alone. On Meta, the targeting is largely automated now (Advantage+ audience expansion is the default); the remaining human lever is the ad itself. A strong creative testing program is the closest thing to a CPC discount on Meta.
Seasonality reprices both auctions. Meta CPMs spike violently in Q4. Australian market data tracked a 68% month-on-month CPM jump in November during Black Friday and Christmas competition, followed by a sharp January fall. Google is less seasonal overall but retail and travel verticals see similar Q4 inflation. Budget plans built on annual medians will underfund November and overfund February.
A note on geography
Every benchmark above is US-weighted, because that is where the large-sample studies publish. Indian auctions typically clear lower in absolute terms, but the ratios travel well: Google search clicks cost several multiples of Meta clicks, intent converts at roughly double the rate of discovery, and cost per customer converges. Convert the dollar figures to rupees at prevailing exchange rates for planning, then replace them with your own account data within the first month. Benchmarks are a starting line, not a forecast.
Meta Ads: cheap clicks, rising costs
Meta’s 2026 benchmarks tell a story of a maturing auction. Average CPM hit $14.19, up 20% year over year from $11.82. Average CPC sits at $0.78, up 11.4%. CTR slipped to 1.55%. The eye-catching number: average CPA jumped 38% to $38.19 from $27.66 the prior year.
That CPA jump looks alarming until you see the offset: conversion rates improved to 8.20% from 7.72%, driven by broader Advantage+ adoption (78% of advertisers now use it) and AI-generated creative tooling. The auction got more expensive, but the machine got better at spending it.
Vertical variance is just as real here. Triple Whale’s data across 40,000+ ad accounts shows beauty CPMs at $18.80 and health and wellness at $21.80, while apparel sits at $13.25. If you sell in a visual, competitive category, budget 30 to 40% above the all-industry average.
The punchline the benchmarks hide
A UK analysis put it best with simple math: Google at £1.55 CPC with 3.5% conversion equals roughly £44 per customer. Meta at £0.78 CPC with 1.8% conversion equals roughly £43 per customer. The click costs 7x more on Google, but the customer costs about the same. Anyone comparing platforms on CPC alone is measuring the wrong thing.
The Business-Type Matrix
Benchmarks are averages. Your business is not average. Here is how the platforms map to business types, based on where each type’s customers actually make decisions.
Local services (plumbers, dentists, electricians, HVAC)
Lead platform: Google Ads. This is the clearest call on the board. Someone searching “emergency plumber near me” at 2am has immediate, location-specific, high-intent need that no social ad can intercept. Service businesses live on captured intent.
Meta still earns a supporting role: retargeting site visitors, promoting seasonal offers (AC tune-ups before summer), and building local brand recall. But the core budget belongs to search.
Starting split: 80% Google / 20% Meta.
Ecommerce and D2C brands
Lead platform: both, in sequence. This is the classic full-funnel pairing. Meta drives discovery of visual products to cold audiences; Google Shopping and branded search capture the buyers Meta warmed up. Industry guidance consistently lands here: Facebook for discovery, Google Shopping for conversion.
The nuance is margin. At thin margins, Google Shopping’s $1.16 average ecommerce CPC is genuinely cheap for bottom-funnel traffic. At healthy margins, Meta’s creative testing becomes the growth engine and deserves the larger share.
Starting split: 50/50, then tilt toward whichever delivers lower cost per acquired customer.
For brands scaling paid social, working with a team that runs Meta Ads management as a dedicated discipline matters more than the split itself, because creative quality drives the majority of Meta performance.
B2B and SaaS
Lead platform: Google first, Meta for nurture. B2B buyers search for solutions with specific, high-intent queries (“salesforce alternative for small teams”, “SOC 2 compliance software”). Those clicks are expensive ($3.33 average B2B CPC, often much higher for competitive terms), but they arrive sales-ready.
Meta’s role in B2B is top-of-funnel: promoting webinars, distributing case studies, retargeting site visitors, and running lookalikes off customer lists. For high-ACV SaaS (above $20,000 annual contract value), a Google-first structure with Meta supporting brand nurture is the standard efficient setup.
Starting split: 70% Google / 30% Meta.
Brand launches and novel products
Lead platform: Meta. If nobody searches for your product because nobody knows it exists, Google has nothing to capture. Launches, innovative gadgets, and new D2C concepts need demand creation first. Meta’s visual formats and interest targeting manufacture the initial awareness, and branded search volume follows months later.
Starting split: 20% Google (branded terms only) / 80% Meta.
Small budgets (under $1,000/month)
Lead platform: Meta, to start. This is arithmetic, not philosophy. At $5.42 average CPC, a $800 monthly Google budget buys about 147 clicks. At $0.78, the same budget buys over 1,000 Meta clicks. Small budgets need volume to learn: to test creative, validate the offer, and find a converting audience. Start on Meta, prove unit economics, then expand to Google once the math works.
The Budget Split Framework
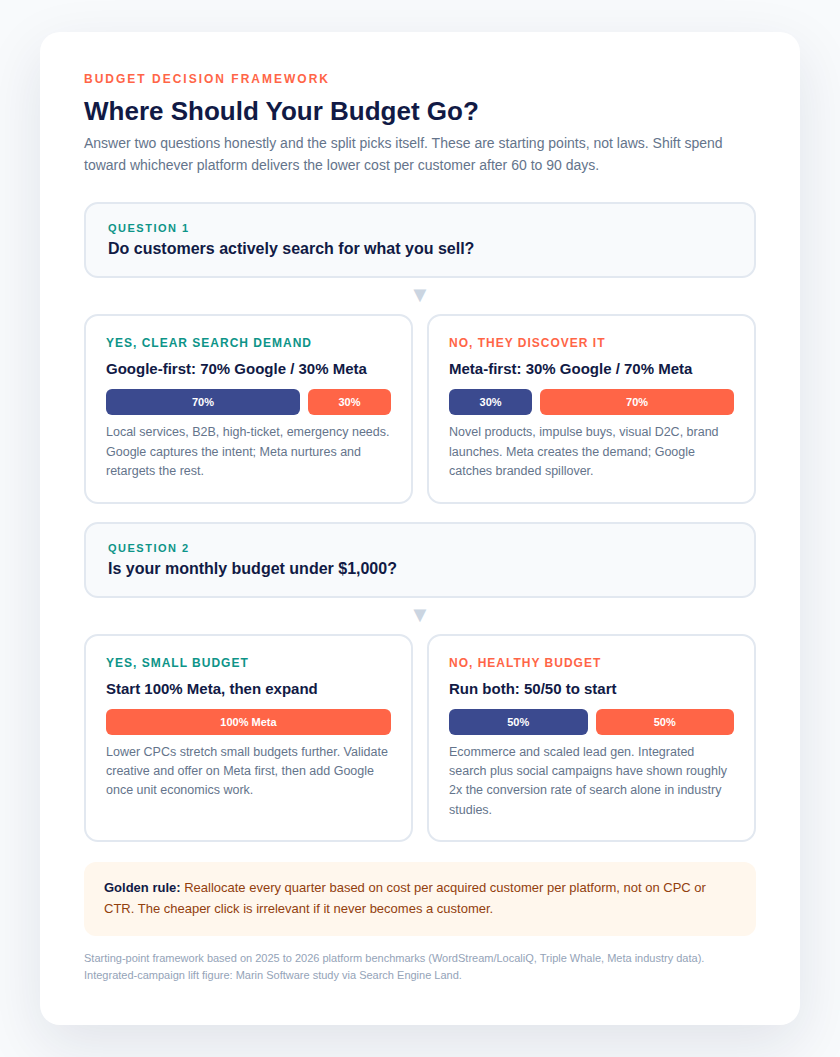
Splits are starting points. The framework that matters is the reallocation rule: every 60 to 90 days, compare cost per acquired customer on each platform and shift 10 to 20% of budget toward the winner. Platforms change, auctions inflate, creative fatigues. A split is a hypothesis, not a contract.
Two questions set the initial split:
Question 1: Do customers actively search for what you sell? Yes means Google-first (70/30). No means Meta-first (30/70).
Question 2: Is the monthly budget under $1,000? Yes means start 100% on Meta to maximize learning volume. No means run both and let the data decide.
Three guardrails keep the framework honest:
- Never split so thin that neither platform exits learning. Meta needs roughly 50 conversion events per ad set per week to optimize; Google needs meaningful click volume per ad group. A $500 budget split across two platforms often means two underfed campaigns instead of one working one.
- Protect branded search on Google regardless of split. Bidding on your own brand terms is cheap insurance against competitors. It is the last budget to cut.
- Judge on cost per customer, never on CPC or CTR. The entire benchmark section above exists to make this point. A $0.78 click that never converts is infinitely more expensive than a $5.42 click that does.
Businesses running Google as their primary channel should treat Google Ads management as an ongoing optimization discipline, not a setup task. The auction punishes neglected accounts through Quality Score decay and wasted spend on irrelevant queries.
When to Use Both: The Full-Funnel Case
The strongest argument against “either/or” comes from Marin Software’s integrated-campaign study, covered by Search Engine Land: advertisers running search and social together saw roughly double the conversions and double the revenue per click compared to search alone, and roughly quadruple compared to social alone. Users who touched both channels converted at dramatically higher rates.
The mechanism is intuitive. Meta introduces the brand to cold audiences. Days later, the prospect searches the brand name or category on Google and converts. Attributed in isolation, Google gets the credit and Meta looks wasteful. Measured incrementally, Meta created the demand Google harvested.
This is also where most businesses misread their data. Last-click attribution systematically overvalues Google and undervalues Meta, because search sits closest to the purchase. If the reporting setup only credits the final touch, Meta will always look like the loser even when it is doing the prospecting work. Any serious dual-platform setup needs either data-driven attribution in Google Analytics or a periodic incrementality check (geo holdouts are the gold standard) to see each platform’s true contribution.
The 90-Day Test Protocol
Frameworks are useless without an execution plan. Here is how to actually run the comparison instead of debating it.
Days 1 to 30: Build and learn. Launch both platforms with the starting split from the framework. Keep targeting simple: Google gets exact and phrase match on core intent keywords plus one Performance Max campaign capped at 20% of Google spend; Meta gets one broad Advantage+ prospecting campaign and one retargeting campaign. Install conversion tracking on both before spending a dollar, and make sure Meta’s Conversions API and Google’s enhanced conversions are firing. The goal this month is not efficiency. It is clean data.
Days 31 to 60: Optimize separately. Fix the obvious leaks on each platform independently. On Google: add negative keywords weekly, split ad groups by intent, test landing page variants for Quality Score. On Meta: kill creative below the account’s median CTR, double down on winning hooks, refresh fatigued ads. Do not reallocate budget yet. Both platforms need a fair, optimized shot before comparison means anything.
Days 61 to 90: Compare and reallocate. Now compute cost per acquired customer per platform using the same attribution window and the same definition of “customer.” Shift 10 to 20% of budget from the loser to the winner. Repeat quarterly. Most accounts converge on a stable split within two cycles, and that split is worth more than any benchmark in this article because it is yours.
One warning: resist judging before day 60. Meta’s learning phase and Google’s Quality Score ramp both punish early verdicts. Accounts killed in week three never had a chance to work.
Five Mistakes That Waste the Split
Most Google-vs-Meta budget failures are not platform problems. They are allocation mistakes that show up identically in account after account.
1. Splitting a small budget across both platforms. A $600 monthly budget divided into two $300 campaigns usually produces two campaigns stuck in learning mode. Meta needs roughly 50 conversion events per ad set per week to optimize; Google needs enough clicks per ad group to judge keyword performance. Below about $1,000 a month, pick one platform, fund it properly, and expand later.
2. Optimizing Meta for the wrong event. Telling Meta to optimize for link clicks trains it to find clickers, not buyers. Always optimize for the conversion event closest to revenue: purchase, qualified lead, booked call. The algorithm is literal. It gives you exactly what you ask for.
3. Judging Meta on last-click attribution. Meta prospecting touches rarely get last-click credit because search sits closer to the purchase. An account judged purely on last-click ROAS will always conclude Meta “doesn’t work” and cut the very prospecting that feeds Google’s branded search volume. Use data-driven attribution at minimum; run a geo holdout test before killing a prospecting campaign.
4. Running the same creative for months. Creative fatigue is the silent Meta budget killer. Performance decays as frequency rises, and industry analyses consistently show refresh cycles of two to three weeks for active accounts. A testing program that produces a steady stream of new concepts is not optional on Meta; it is the media strategy.
5. Treating the split as permanent. Auctions inflate, competitors enter, creative fatigues, seasonality hits. The split that worked in March can be wrong by September. The reallocation rule from the framework section exists because static budgets decay. Review cost per acquired customer per platform quarterly and move 10 to 20% of spend toward the winner.
Three Real-World Scenarios
Scenario 1: Local dental clinic, $2,500/month
Search demand is clear (“dentist near me”, “teeth whitening cost”), intent is urgent, and the service area is a 15km radius. Google Search captures the high-intent queries; Meta retargets website visitors and promotes seasonal whitening offers to local audiences.
Recommended split: 80% Google ($2,000) / 20% Meta ($500). Google budget goes to exact-match service keywords plus a small branded defense campaign. Meta runs one retargeting campaign and one local awareness campaign with offer-led creative. Expected outcome: Google drives the majority of booked appointments; Meta keeps the clinic visible between need moments.
Rough planning math: $2,000 on Google at the all-industry median $5.42 CPC buys about 370 clicks. At an 8% landing page conversion rate, that is roughly 30 consultation requests. Actual dental CPCs and conversion rates vary, so treat this as a sanity check, not a promise.
Scenario 2: D2C skincare brand, $8,000/month
Visual product, impulse-friendly price point, no existing search demand for the brand name. Meta is the discovery engine: UGC-style video creative, broad targeting with Advantage+, continuous creative testing. Google captures branded spillover and Shopping placements for category terms.
Recommended split: 35% Google ($2,800) / 65% Meta ($5,200). Meta budget funds a testing campaign (15 to 20% of Meta spend) plus scaling winners. Google runs Shopping and branded search. Expected outcome: Meta drives the majority of new-customer acquisition; Google converts the warmest traffic at the lowest CPA. Ecommerce brands at this stage often benefit from dedicated PPC management for ecommerce that coordinates both platforms instead of running them as separate silos.
Rough planning math: $5,200 on Meta at the $0.78 median CPC buys about 6,600 clicks. At a 1.5% purchase conversion rate (midpoint of the 0.5 to 1.5% paid-social ecommerce range), that is roughly 100 orders. If average order value is $60, that is $6,000 in Meta-attributed revenue before accounting for the Google-assisted conversions Meta influenced.
Scenario 3: B2B SaaS, $15,000/month
Buyers search specific solution queries with high intent. Sales cycle is 60 to 90 days, ACV is $12,000. Google Search captures bottom-funnel demand; Meta nurtures with case studies, webinar registrations, and account-based retargeting.
Recommended split: 70% Google ($10,500) / 30% Meta ($4,500). Google budget concentrates on high-intent keywords with tight match types and a Performance Max campaign at 10 to 25% of the Google budget for incremental reach. Meta runs lead-gen for content offers and retargeting sequences synced to the CRM. Expected outcome: Google delivers demo-ready leads at the highest intent; Meta shortens the sales cycle by keeping the brand in front of buying committees.
Frequently Asked Questions
Is Google Ads or Meta Ads cheaper?
Meta clicks are cheaper (around $0.78 median CPC vs $5.42 on Google Search), but cost per customer is often similar because search intent converts at higher rates. Compare platforms on cost per acquired customer, never on CPC alone.
Can a small business run both with $500/month?
No, not effectively. Below roughly $1,000 a month, splitting means neither platform gets enough volume to exit learning mode. Start 100% on one platform, prove unit economics, then expand.
Which platform is better for B2B lead generation?
Google Ads for capturing high-intent searches, Meta for nurturing long sales cycles with content and retargeting. Most efficient B2B setups run roughly 70% Google and 30% Meta, then reallocate quarterly on cost-per-qualified-lead data.
Do Meta Ads work if nobody searches for my product?
That is exactly when Meta works best. Discovery-based products, launches, and visual D2C brands use Meta to create demand that did not exist, then capture branded search spillover on Google later.
How long before judging which platform wins?
At least 60 days with optimized campaigns on both sides. Meta’s learning phase and Google’s Quality Score ramp both punish early verdicts. Compare cost per customer at day 60 to 90, then shift 10 to 20% of budget toward the winner.
The Bottom Line
“Google Ads or Meta Ads” was never the right question. The right questions are: where does your customer’s decision happen, how much can you spend to learn, and what does each acquired customer actually cost per platform?
Start with the framework: search demand means Google-first, discovery means Meta-first, small budgets mean Meta to learn, healthy budgets mean both. Then let 60 to 90 days of cost-per-customer data override every assumption in this article, including the splits above. The platform that earns the next dollar is the one that earned the last customer cheapest. Everything else is commentary.