
Meta Ads Creative Testing: The Framework That Finds Winners
Most advertisers test creative the same way: launch three to five ads, wait a month, look at the numbers, repeat. That is not testing. That is guessing with extra steps.
The difference between accounts that scale and accounts that stall is rarely budget or targeting. Meta’s algorithm handles audience optimization automatically now. The competitive edge lives in creative, and creative is a volume game that rewards systems, not inspiration.
Nielsen research found that creativity drives 56% of a campaign’s sales ROI. Google’s own analysis puts the figure at 70% of campaign success determined by creative. Meta’s partnership with research firm Nepa confirmed that following creative best practices can drive 1.2 to 2.7 times higher long-term sales and 1.2 to 7.4 times higher short-term sales. In Meta’s CPG effectiveness study, campaigns with high-quality creative achieved 35% greater effectiveness than those without.
Yet only about 5% of ads ever perform well enough to replace the current best performer. Most DTC brands operate at roughly a 10% creative hit rate, meaning nine out of ten concepts burn budget without returning it. The top 1.4% of ad accounts produce 36% of all creative on the platform. The gap is not talent. It is testing infrastructure.
This guide lays out the complete framework: how to structure tests, when to kill losers, when to scale winners, how to detect fatigue before it costs money, and the mistakes that invalidate everything.
Why Most Creative Testing Fails
Before the framework, it helps to name the failure modes. Almost every broken testing process suffers from at least three of these.
Testing too few variants. If only 5% of ads become winners, testing five ads per month means finding roughly one winner every four months. Leading brands test 50 to 200 creative variations monthly. The math is unforgiving: low volume equals slow learning.
Changing multiple variables at once. A new hook, new visual, new offer, and new format launched simultaneously produces a result nobody can interpret. When it wins, nobody knows why. When it loses, nobody knows what to fix. Each test must isolate exactly one variable.
Reading results too early. Declaring a winner at 12 conversions is noise, not signal. Early leaders frequently lose over a full sample. The urge to call tests early is strong because waiting feels expensive, but acting on noise is more expensive.
Mixing testing with scaling. Running untested creative in the same campaign as proven winners lets the algorithm starve new variants before they get a fair read. Meta allocates roughly 80% of budget to early favorites inside a single ad set. Testing needs its own sandbox.
Optimizing for the wrong metric. Judging creative on CTR alone rewards clickbait that does not convert. Winners must be read on cost per result at volume. A high-CTR ad with terrible conversion rate is not a winner. It is a trap.
No kill discipline. Losers stay live for weeks because nobody defined what “losing” means in advance. Industry data suggests 30 to 40% of ad spend goes to underperforming variants before they get paused. That is budget that should have funded the next test.
The 6-Stage Framework
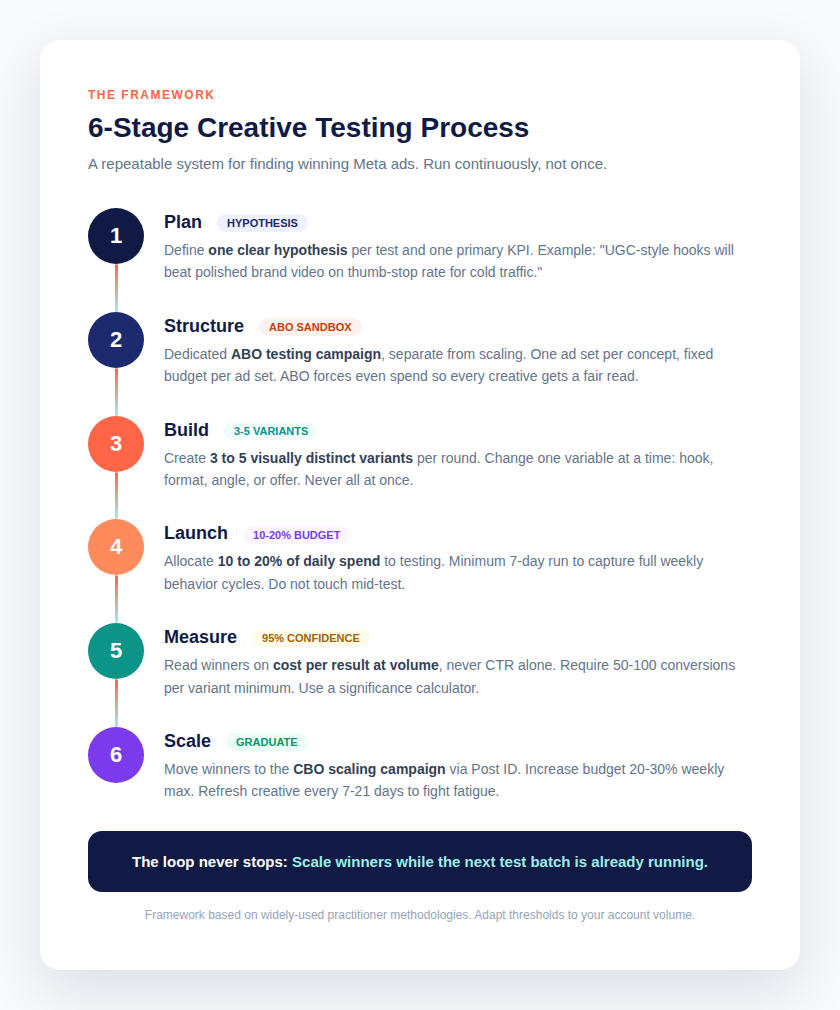
The framework is a continuous loop, not a one-time project. Six stages, always running.
Stage 1: Plan (Hypothesis)
Every test starts with one written hypothesis and one primary KPI. Not a vague goal. A falsifiable statement.
Weak: “Let’s try some new creatives and see what happens.”
Strong: “UGC-style hooks will beat polished brand video on thumb-stop rate for cold traffic, because our audience responds to authenticity signals over production value.”
The hypothesis forces clarity about what is being tested and why. It also prevents the most common testing sin: launching creative with no learning objective, then retrofitting a story onto random results.
One hypothesis per test. One primary metric per test. Everything else is secondary observation.
Stage 2: Structure (ABO Sandbox)
Testing happens in a dedicated ABO (Ad Set Budget Optimization) campaign, completely separate from scaling campaigns. This is the sandbox where new creative earns its place.
The structure:
- One campaign, manual sales or leads objective
- One ad set per creative concept being tested
- Fixed daily budget per ad set (minimum 1x target CPA, ideally 3x)
- 3 to 6 ads per ad set, or one Dynamic Creative test
- Same audience across all test ad sets (creative is the only variable)
ABO matters because it forces even spend. In a CBO (Campaign Budget Optimization) campaign, Meta funnels budget to early favorites within hours, starving new variants before they accumulate meaningful data. For testing, that algorithmic efficiency is the enemy. ABO guarantees each concept gets its allocated budget regardless of early performance.
A common question: why not test inside the scaling campaign? Because testing data pollutes scaling performance. Untested creative drags down the campaign average, the algorithm gets confused signals, and winners never get clean reads. The two-campaign model exists for a reason: in testing you learn, in scaling you earn.
Stage 3: Build (3 to 5 Variants)
Build three to five visually distinct variants per test round. “Distinct” is doing heavy work here. Changing the background color is not a variant. Changing the hook, the format, the angle, or the offer is.
Prioritize variables by leverage:
- Hook (first 3 seconds of video, or headline for static). Highest leverage. The hook determines whether anyone sees the rest. Test hooks before anything else.
- Concept/angle (pain point vs. benefit vs. social proof vs. comparison). Different reasons to buy.
- Format (15-second vertical, 30-second, carousel, static). What works in Reels often fails in feed.
- Offer (percentage off vs. dollar amount, free shipping vs. free gift). Offer changes often produce bigger swings than creative changes.
- CTA (button text, placement). Lower leverage, test last.
The isolation rule is absolute: one variable changes per test. A hook test keeps the same offer, body copy, CTA, format, and audience. Only the first three seconds change. An offer test keeps everything identical except the offer framing. Violate this and the results are uninterpretable.
For video, the 3-second view rate reveals hook strength before full watch behavior matters. A hook passes if the 3-second view rate exceeds roughly 30% on Meta. For static, the headline carries equivalent weight.
Stage 4: Launch (10 to 20% of Budget)
Allocate 10 to 20% of total daily spend to the testing campaign. This is the standard range across practitioner frameworks. Below 10%, tests take too long to reach significance. Above 20%, testing cannibalizes scaling budget.
Minimum test duration is 7 days. This is non-negotiable because Meta needs full weekly cycles to capture weekday and weekend behavior patterns. Cutting a test at day 4 because “the data looks clear” ignores the fact that weekend buyers behave differently from weekday buyers.
During the test: do not touch anything. No budget changes, no creative swaps, no audience tweaks. Every manual change risks resetting Meta’s learning phase, which requires roughly 50 conversions to exit. During learning, cost per conversion runs 20 to 50% higher. Fiddling with tests mid-flight does not speed up learning. It restarts it.
Check delivery on day 3 to 4 (are both variants spending roughly equally?), but do not make decisions. Day 7 is the earliest for a technical check. Day 14 is the first real data review.
Stage 5: Measure (95% Confidence)
Read winners on cost per result at volume. Not CTR. Not engagement rate. Not ROAS in isolation. The question is always: which variant delivers the target action at the lowest cost, with enough volume to trust the read?
Sample size thresholds:
- 50 conversions per variant: minimum for a directional read. Below this, results are noise.
- 100 conversions per variant: reliable read for most accounts.
- 200 to 500 conversions per variant: high confidence, appropriate for major budget decisions.
Use a statistical significance calculator before declaring winners. Target 95% confidence as the standard. Accept 90% for directional reads when volume is constrained, but label it clearly as directional.
The math behind this: to detect a 20% improvement with 95% confidence, a typical account needs roughly 400 conversions per variant. To detect a 30% improvement, roughly 178. Most ad tests should target the 20 to 30% range because smaller effects are rarely worth the optimization effort.
If budget cannot reach significance within 21 days, the test is not worth running as a controlled experiment. Use directional data, label it honestly, and move on. Running underpowered tests and treating them as conclusive is worse than not testing, because it creates false confidence.
Early kill signals (valid reasons to stop before the planned end):
- One variant has CPA 3x or higher than the other after 100+ conversions. Kill the loser, save the spend.
- A variant has delivery problems and is not spending. Fix the technical issue or kill it.
- Frequency crosses 3.0 on cold traffic while CPA is already above target. The test is contaminated by fatigue.
What does not justify early kills: “it feels like” one is winning, day-2 CTR differences, or impatience. Discipline means waiting for the pre-set sample size.
Stage 6: Scale (Graduate Winners)
Winners graduate from the ABO testing campaign to the CBO scaling campaign. The mechanics:
- Note the winning ad’s Post ID in the testing campaign
- In the scaling campaign, use “Use Existing Post” to add the winner (preserves social proof)
- Pause the original in the testing campaign
- Start scaling budget at 2 to 3x what the ad set spent in testing
Scale budgets in 20 to 30% increments, maximum once per week. Doubling budget overnight resets learning and destroys the performance you just validated. Patience in scaling protects the winner.
The scaling campaign runs CBO because the algorithm is now an ally, not an enemy. With proven creative, letting Meta distribute budget to the best performers maximizes efficiency. The standard account structure is one CBO scaling campaign (70 to 80% of budget) plus one ABO testing campaign (10 to 20%), with retargeting as a third campaign if budget supports it.
Critical: the testing campaign never stops. While winners scale, the next batch is already in the sandbox. This continuous pipeline is what separates durable accounts from ones that spike and collapse when their two hero creatives fatigue.
Kill Rules and Graduation Criteria
Vague testing produces vague results. These thresholds turn judgment calls into system outputs.
Graduate a creative to scaling when all of these are true:
- CPA at or below target for 48 to 72 consecutive hours
- At least 50 conversions accumulated (100 preferred)
- CTR above the account average for the same audience
- For video: hook rate (3-second views divided by impressions) above 25%
Kill a creative when any of these are true:
- CPA exceeds 2x target after 5 full days of delivery
- Zero conversions after spending 1x target CPA with adequate impressions
- Frequency above 3.0 on cold traffic combined with CPA above target
- CTR drops more than 40% from its own peak (fatigue, not a testing failure, but the outcome is the same)
The gray zone (neither clear winner nor clear loser after 14 days):
- If CPA is within 1.3x of target and volume is growing, extend 7 more days
- If CPA is flat at 1.5x target with no improvement trend, kill it
- If two variants are within 10% of each other on CPA, both graduate or the cheaper one does; do not over-optimize marginal differences
Write these rules down before launching. The entire point is removing emotion from the decision. When the numbers hit the threshold, the action is automatic.
Creative Fatigue: Detection and Refresh
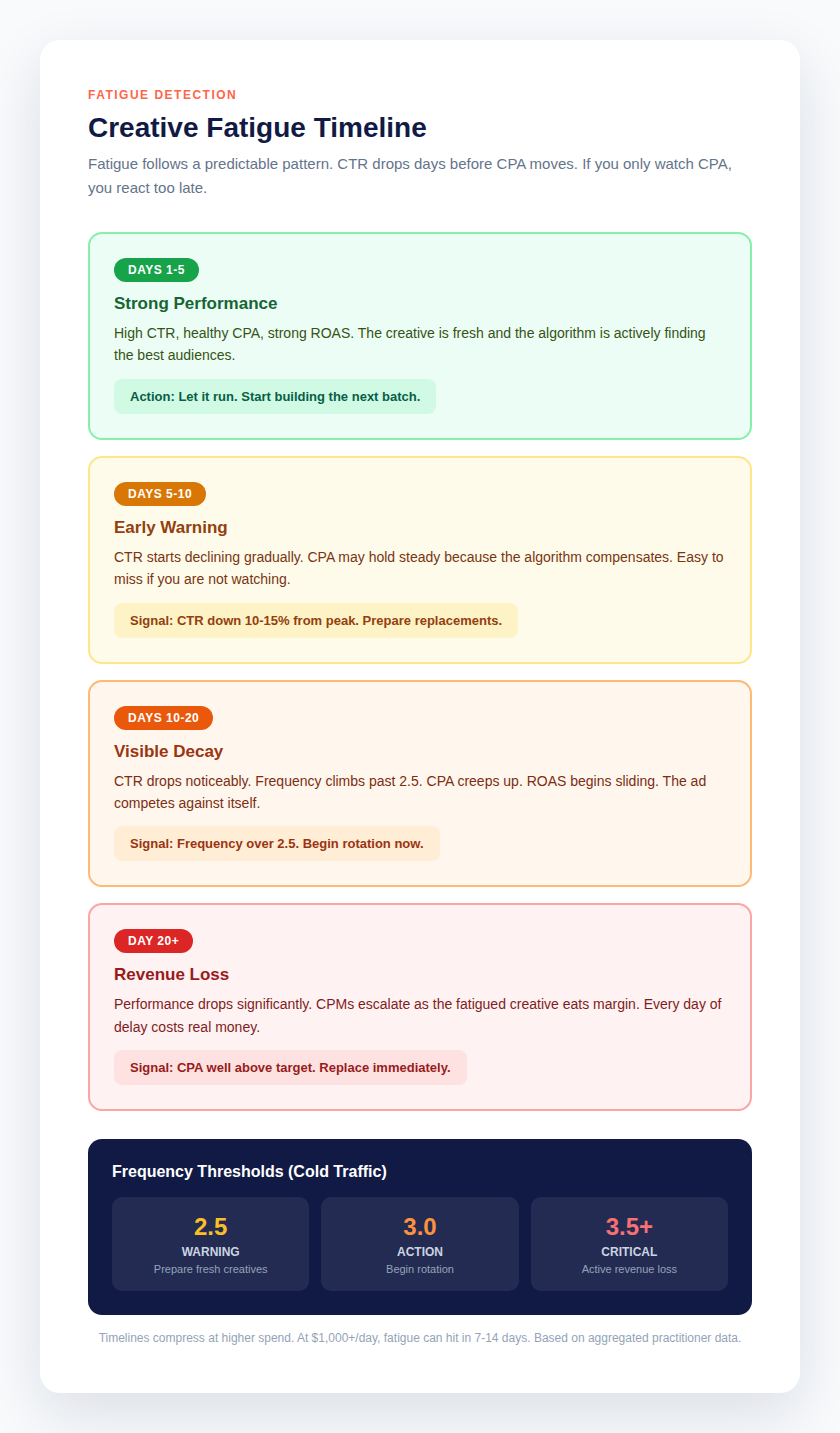
Fatigue is not a possibility. It is a certainty with a timeline. Meta’s Andromeda algorithm update in mid-2025 accelerated the decay: winning creatives that once lasted 20 to 25 days now fatigue in 7 to 12 days for most advertisers, and as fast as 5 to 6 days for UGC-style video at higher spend.
The data across practitioner sources converges:
- Median ad lifespan before significant decay: roughly 21 days
- At $200 to $500 per day, strong creative lasts 10 to 20 days
- At $1,000+ per day, the window shrinks to 7 to 14 days
- CTR typically drops 20 to 30% after the first month
- Ads left unchanged for five weeks lose approximately 38% of their effectiveness
- High-performing accounts refresh creative every 10.4 days on average
The key insight: fatigue shows in CTR days before it shows in CPA. The algorithm compensates for declining engagement by bidding higher or shifting delivery, which masks the decay in CPA temporarily. Advertisers who only monitor CPA always react too late. Watch CTR trend lines and frequency together.
Frequency thresholds for cold traffic:
- 2.5: Warning. Prepare fresh creatives.
- 3.0: Action. Begin rotation.
- 3.5+: Critical. Active revenue loss if no replacements are live.
For retargeting audiences, thresholds are higher (4 to 6) because the audience is smaller and warmer, but the same principle applies.
Refresh strategies by severity:
- Early fatigue (CTR down 10-15%): Partial refresh. Swap the hook or headline while keeping the winning body. This extends effectiveness by 30 to 40% with minimal effort.
- Moderate fatigue (CTR down 20-30%, frequency climbing): Format shift. Turn the winning static into video, or the winning video into a carousel. Same concept, new delivery.
- Severe fatigue (CPA well above target, frequency 3.5+): Complete overhaul. New angles, new visuals, potentially new creators. The concept is exhausted.
Two lesser-known tactics: pausing a fatigued ad for 30 to 45 days can restore 60 to 70% of its original performance when reintroduced, because audience memory decays. And founder-led content extends creative lifespan by roughly 28% compared to standard UGC, likely because authentic faces resist banner blindness longer.
The structural fix is a rotation calendar, not heroic last-minute production. If fatigue hits every 10 days and production takes 21 days, the math never works. Build the pipeline so fresh creative launches weekly, overlapping with current winners rather than replacing them in panicked swaps.
For businesses running paid media at scale, this testing infrastructure is exactly what separates profitable accounts from money pits. SCORSH builds these systems as part of its paid media management, where creative testing is treated as the core method rather than an afterthought.
Budget Allocation for Testing
The standard split: 10 to 20% of daily spend goes to testing, 70 to 80% to scaling proven winners, with the remainder for retargeting if budget allows.
In absolute terms, each test ad set needs enough daily budget to reach 50 conversions within a reasonable window. The widely cited minimum is 1x target CPA per day per ad set, with 3x preferred. Below 1x CPA per day, the ad set may never exit learning, and the test produces nothing usable.
Worked example: target CPA is $20. Each test ad set gets $20 to $60 per day. Testing 3 concepts simultaneously means $60 to $180 per day in test spend. At $60 per day per ad set, reaching 50 conversions takes roughly 17 days at target CPA. At $20 per day, it takes 50 days, which is too slow. This is why the 3x CPA guideline exists: it compresses the learning timeline to something operationally useful.
For small budgets (under $100 per day total), testing gets harder but not impossible. The realistic pace is 3 to 5 creative tests per month versus 20 to 50 for well-funded teams. At this level, prioritize ruthlessly: test hooks first (highest leverage), use the 3×3 method (three concepts, three variations each, judged directionally around day 7 to 10), and accept directional reads over statistical certainty. Something is always better than nothing, as long as the limitations are acknowledged.
The 10% / 10x framework (attributed to practitioner Sam Tomlinson) splits testing budget further: 10% of testing spend on incremental optimization of what works (expect 10 to 30% improvements), and 10% on fundamentally new bets (most fail, rare wins deliver 2 to 10x). Teams that only run incremental tests stagnate. Teams that only swing for fences lose predictability. Both buckets matter.
7 Mistakes That Invalidate Tests
1. Testing in the scaling campaign. Untested creative in a CBO scaling campaign gets starved by the algorithm before accumulating data. The 80/20 budget allocation inside ad sets means early favorites eat everything. Always use a separate ABO sandbox.
2. Changing multiple variables. New hook plus new visual plus new offer equals uninterpretable results. One variable per test. Label every creative with the variable it isolates before launch.
3. Declaring winners too early. Below 50 conversions per variant, the leader is often a mirage. Early leaders frequently lose over full samples. Set the sample size before launching and honor it.
4. Judging on CTR alone. High CTR with poor conversion rate is clickbait, not a winner. Always read on cost per result at volume. CTR is a diagnostic metric for hooks, not a success metric for creative.
5. Ignoring audience overlap. Testing the same creative across overlapping audiences without exclusions contaminates results. Use proper exclusions, especially when testing audience segments.
6. Stopping tests at arbitrary calendar dates. “We always test for exactly 7 days” ignores whether significance was reached. Duration should be driven by sample size, with 7 days as a minimum for weekly cycles, not a fixed endpoint.
7. No documentation. Tests without written hypotheses, documented structures, and recorded outcomes produce no institutional learning. Every test should log: hypothesis, variable isolated, structure used, sample size reached, result, and decision. The account’s testing history is a strategic asset.
Testing at Different Budget Levels
The framework scales, but the tactics shift with spend.
Under $3,000 per month. Testing budget is $300 to $600. Realistic pace: 3 to 5 creative tests monthly. Prioritize hooks exclusively for the first 90 days, because hook improvements deliver the highest ROI per test. Use static images and simple video edits rather than expensive production. Accept directional reads at 30 to 50 conversions per variant, but document the limitation. One strong winner per quarter can transform an account at this level.
$3,000 to $15,000 per month. Testing budget is $300 to $3,000. This is the sweet spot for the full framework. Run the ABO sandbox with 3 to 4 concepts simultaneously. Reach 50 to 100 conversions per variant within 2 to 3 weeks. Maintain a rotation calendar with weekly launches. Most mid-size DTC brands live here, and disciplined execution at this tier beats sloppy execution at higher spend.
$15,000 to $100,000 per month. Testing budget is $1,500 to $20,000. Volume supports 15 to 30 new variants weekly. Fatigue timelines compress hard: at $1,000+ per day, strong creative lasts 7 to 14 days. The bottleneck shifts from budget to production speed. This is where AI generation tools earn their keep, producing variant volume that human teams cannot match. Dedicated creative strategists become necessary, not optional.
$100,000+ per month. Testing is a full operation. Multiple ABO sandboxes segmented by funnel stage or product line. Creative hit rate becomes the headline KPI. At this scale, a 2-point improvement in hit rate is worth more than any single winning ad. Invest in systematic creative research: competitor ad mining, comment-section insights, review analysis. The testing framework stays the same. Everything around it professionalizes.
Where AI Fits in Creative Testing
AI tools have changed the production side of testing, not the strategy side. That distinction matters.
What AI does well: generating variant volume. Tools can now produce dozens of hook variations, background swaps, and format adaptations from a single base creative in hours rather than weeks. For the volume problem (needing 20 to 50 variants monthly), AI is the practical answer for most teams. Meta’s own data suggests Advantage+ creative enhancements reduce cost per result by roughly 4%, a modest but real gain.
What AI does not do: set hypotheses, define kill rules, or interpret results. The strategic layer (what to test, why, and what the results mean) remains human work. Teams that outsource thinking to AI get volume without learning. Teams that use AI for production while keeping humans on strategy get both.
The practical setup: humans define the test matrix (which angles, which hooks, which offers to explore). AI generates the variants within those parameters. Humans read the results and decide what graduates. This division plays to each side’s strength: AI for speed, humans for judgment.
One caution: AI-generated creative still needs the same testing discipline. A batch of 30 AI variants with no hypothesis and no isolation is not testing. It is spam with better production values. The framework does not change because the production method did.
Putting It Together: The Weekly Operating Rhythm
Theory without cadence dies. Here is what the framework looks like in weekly operation:
Monday: Review fatigue dashboard. Flag any creative crossing frequency 2.5 or CTR down 15% from peak. Check test campaign for variants approaching sample size.
Tuesday: Graduate winners (move Post IDs to scaling). Kill losers per the rules. No emotion, just thresholds.
Wednesday: Launch the next test batch in the ABO sandbox. Three to five new variants, one variable each, hypotheses documented.
Thursday: Review scaling campaign health. Adjust budgets in 20% increments if needed. Check that testing spend is holding at 10 to 20% of total.
Friday: Production planning. What does next week’s test batch need? Briefs go out with enough lead time that creative is ready before current winners fatigue.
This rhythm turns creative testing from a sporadic effort into a production system. The accounts that win on Meta are not the ones with the best single ad. They are the ones with the best pipeline for finding the next one.
For brands that want this system built and managed rather than DIY, SCORSH’s approach to creative and UGC production feeds directly into structured testing pipelines, and the landing page and CRO work ensures winning creative drives to pages built to convert the traffic it generates.
—
Sources: Nielsen (creativity drives 56% of sales ROI); Google Think (70% of campaign success from creative); Meta x Nepa research via Facebook IQ (creative best practices impact on sales); Meta CPG MMM study via Facebook IQ (35% effectiveness lift); practitioner data aggregated from Segwise, AdManage.ai, TheOptimizer, AdAmigo.ai, and Meta ads research compilations. Fatigue timelines and frequency thresholds reflect post-Andromeda (mid-2025) practitioner observations and will vary by account, spend level, and audience size.